The Alpine Helen/White County Convention & Visitors Bureau's monthly report for March 2026 — filed by CVB Director Jerry Brown as a standing agenda item at the Helen City Commission's called meeting on March 17 and entered into the permanent minutes prepared by City Clerk Marilyn M. Chastain — contains a single compound sentence of website analytics data, presented without context, comparison, or interpretive commentary of any kind. Over the month of March, the CVB's public-facing tourism website recorded 108,000 total visits from 101,000 unique or new visitors, who viewed an average of 3.45 pages per session across a combined 454,000 page views, at a bounce rate of 49.50 percent. Each visit lasted, on average, two minutes and 58 seconds.
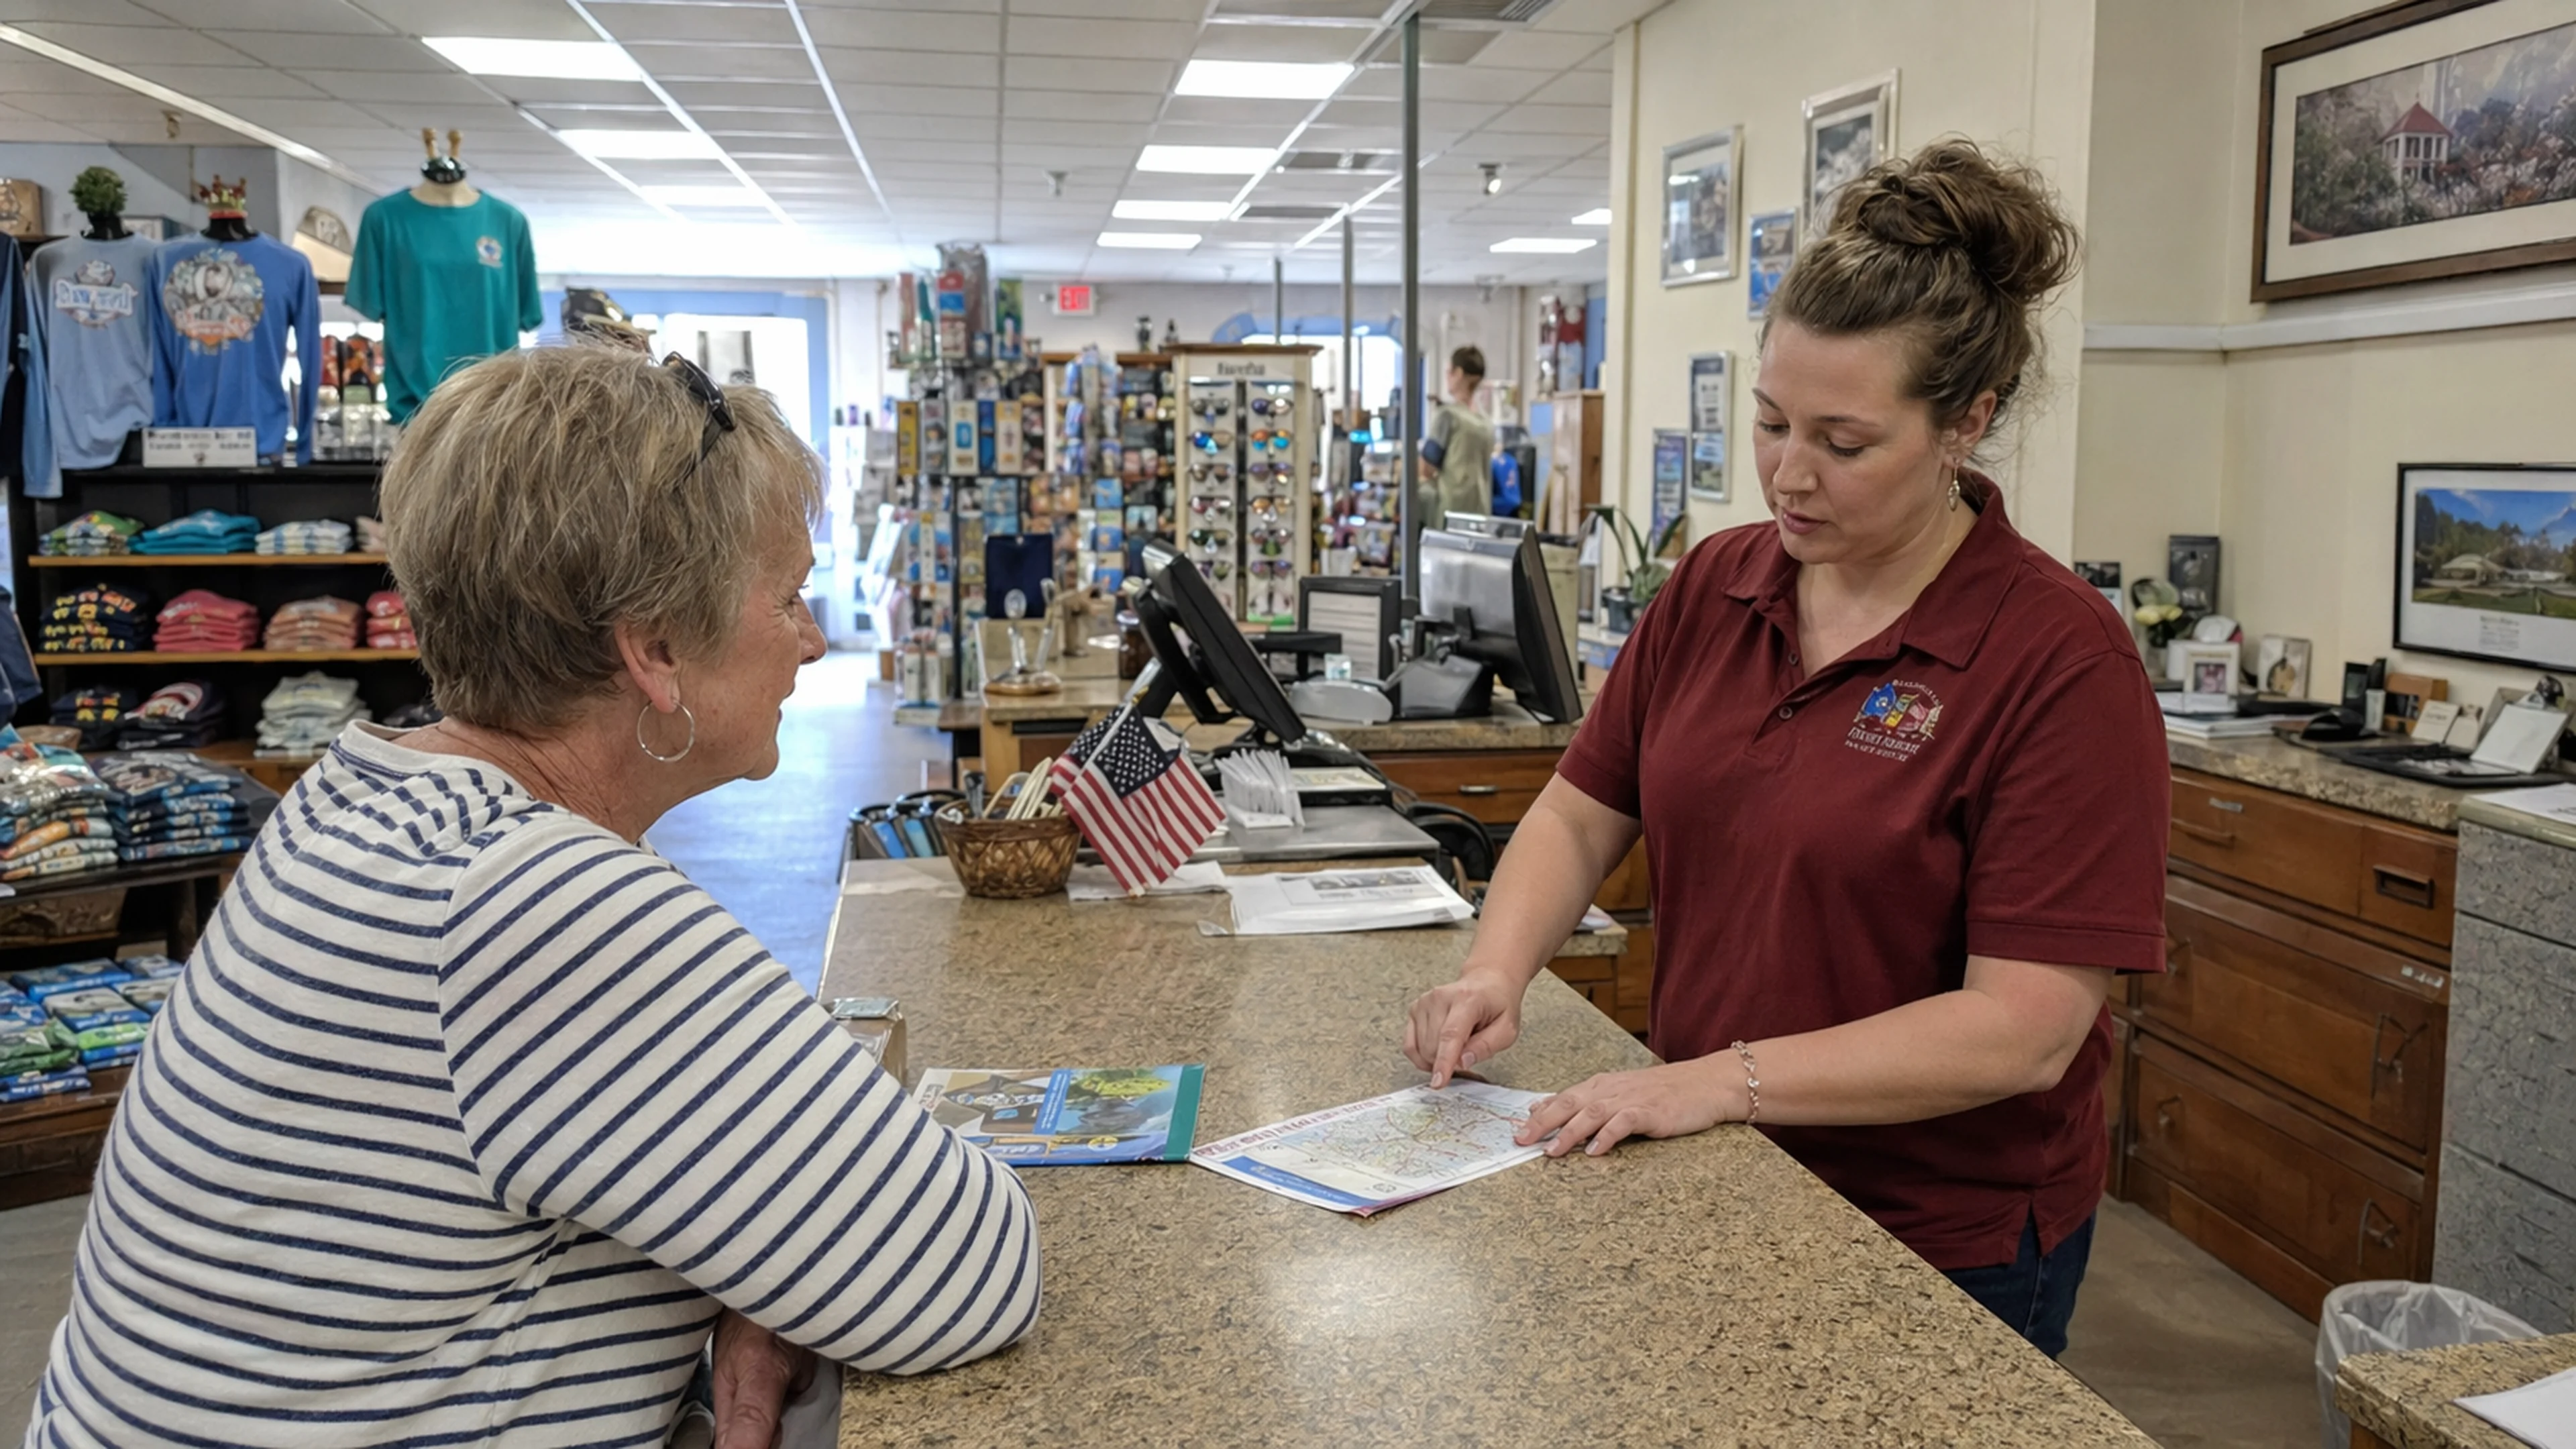
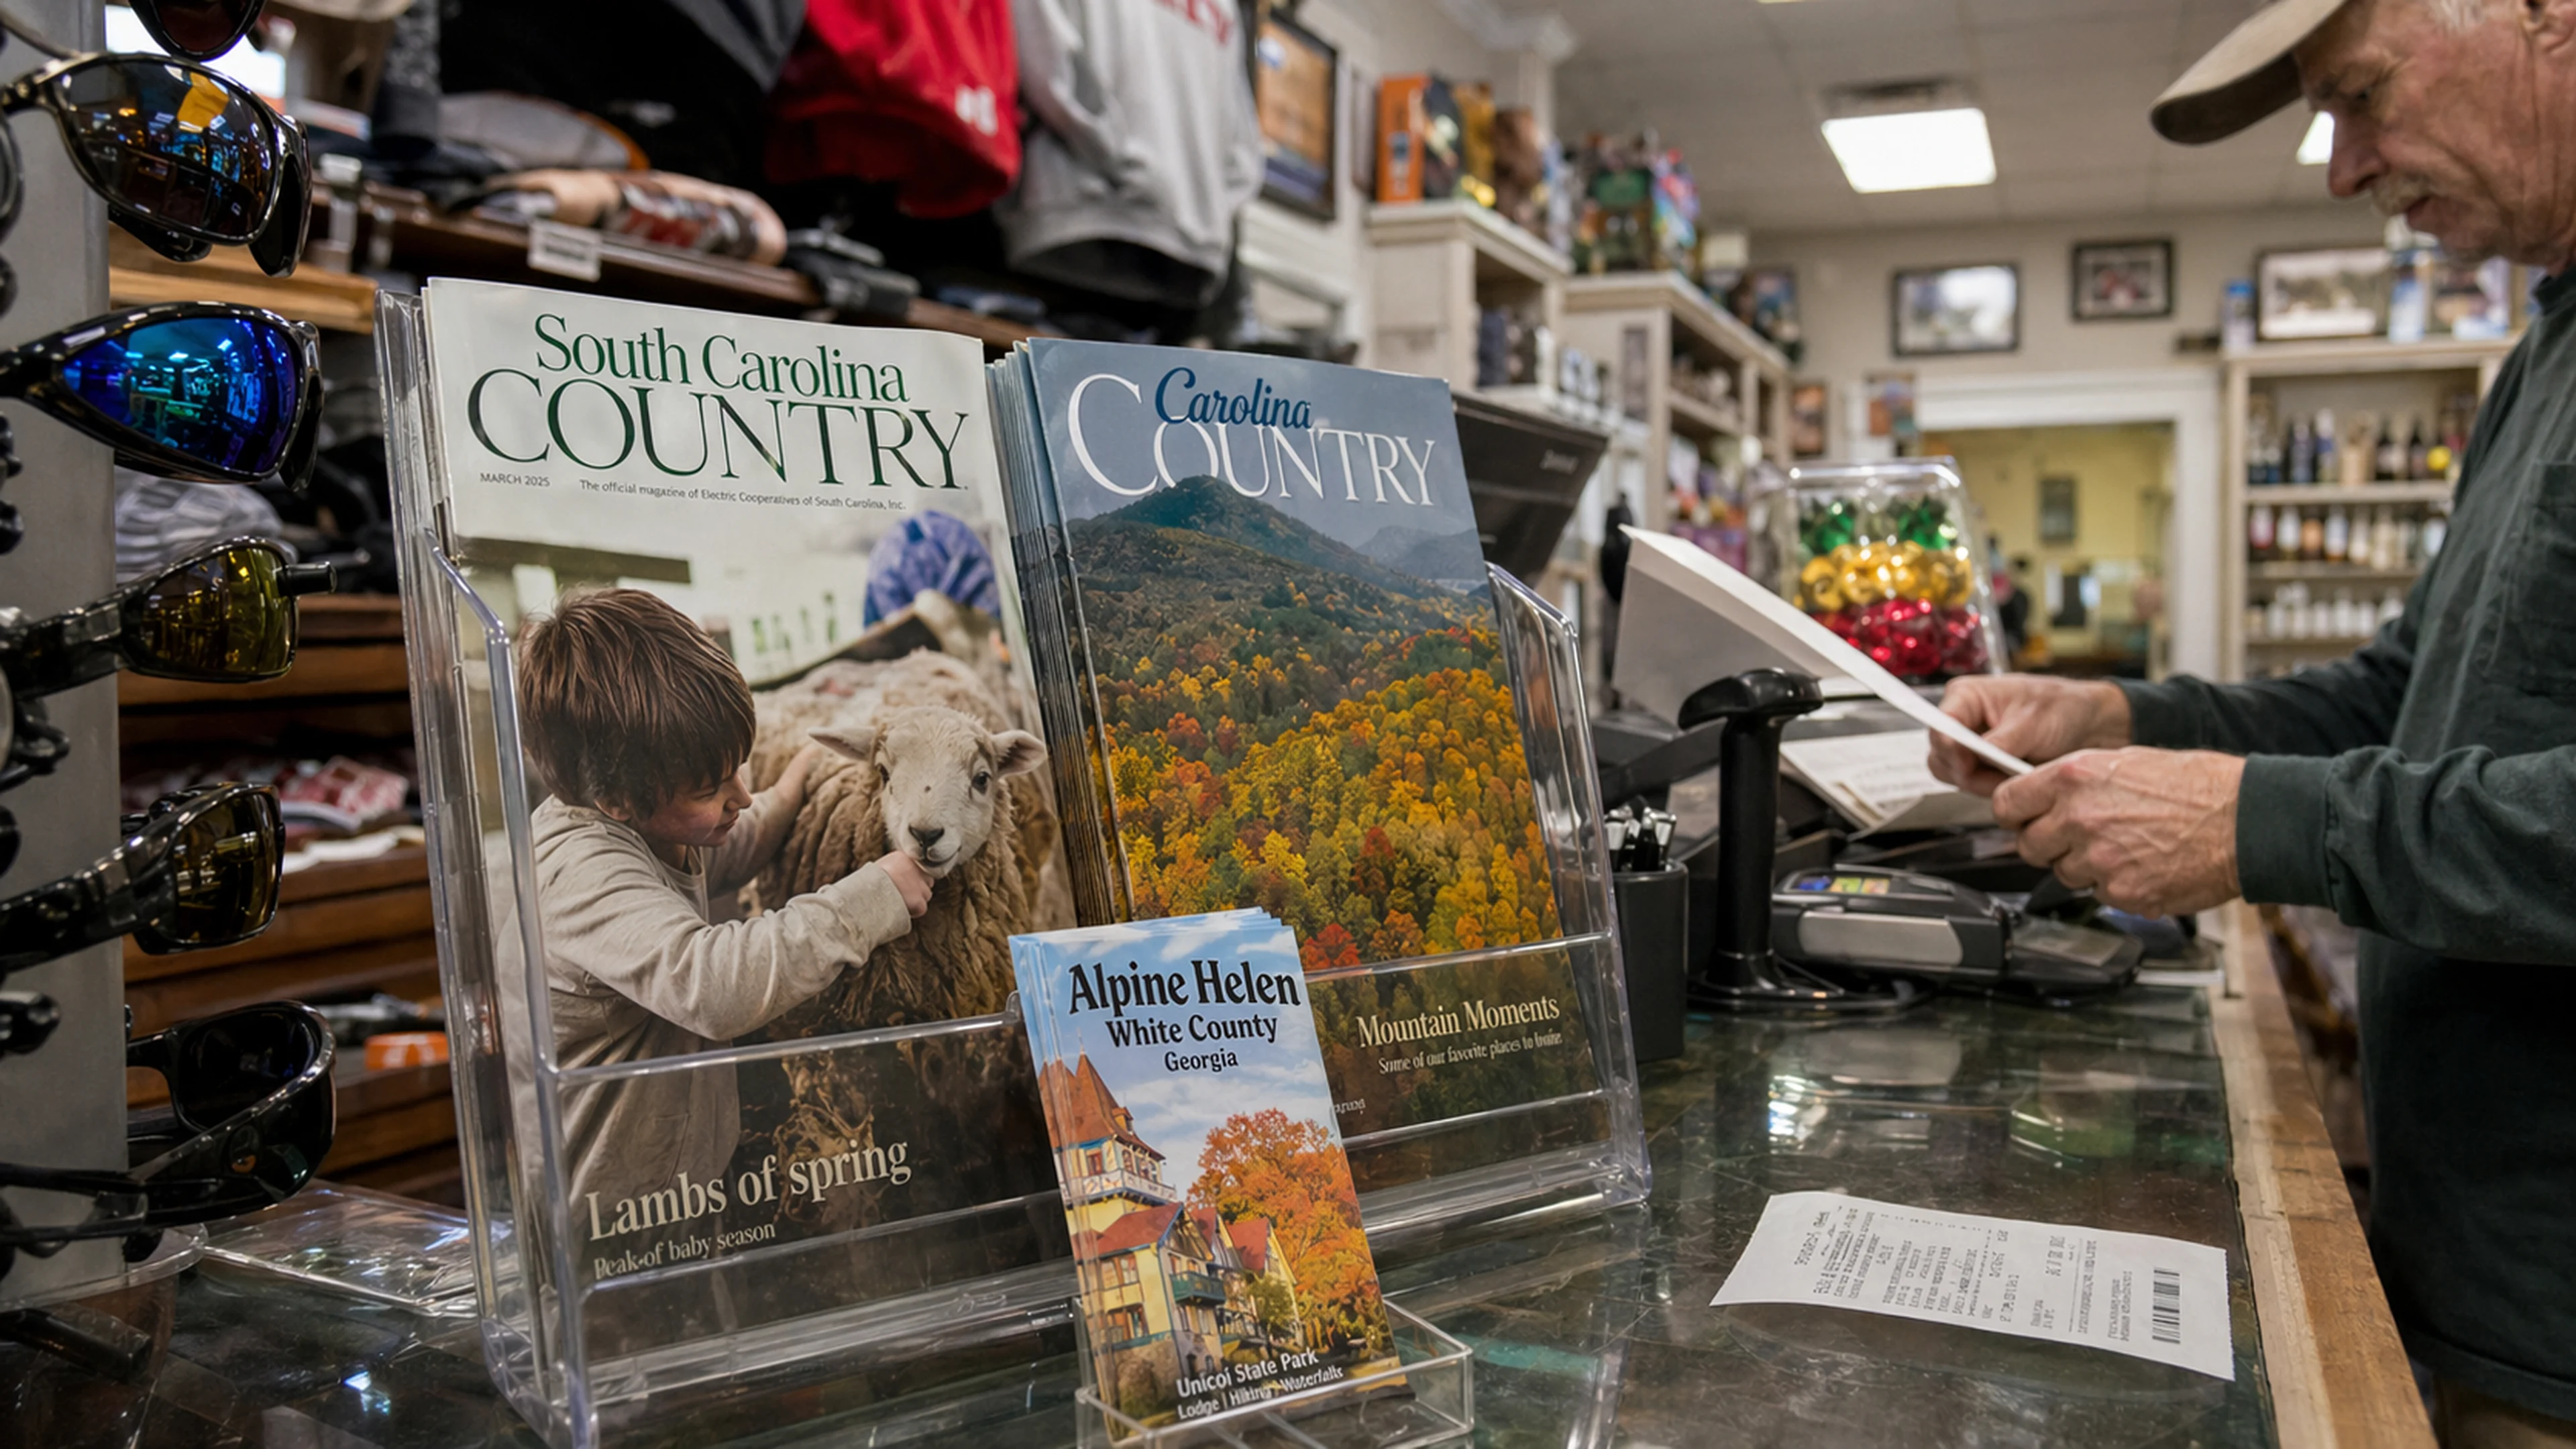
The figure appears on the report between a line noting 2,570 visitors to the Helen Welcome Center and a summary of 230 cases of Helen Travel Guides delivered to regional distribution points. It is not bolded. It is not flagged. It is not compared to any prior month, any industry standard, or any internal target. It sits in the document the way a load-bearing wall sits inside a house — structurally decisive, cosmetically invisible.
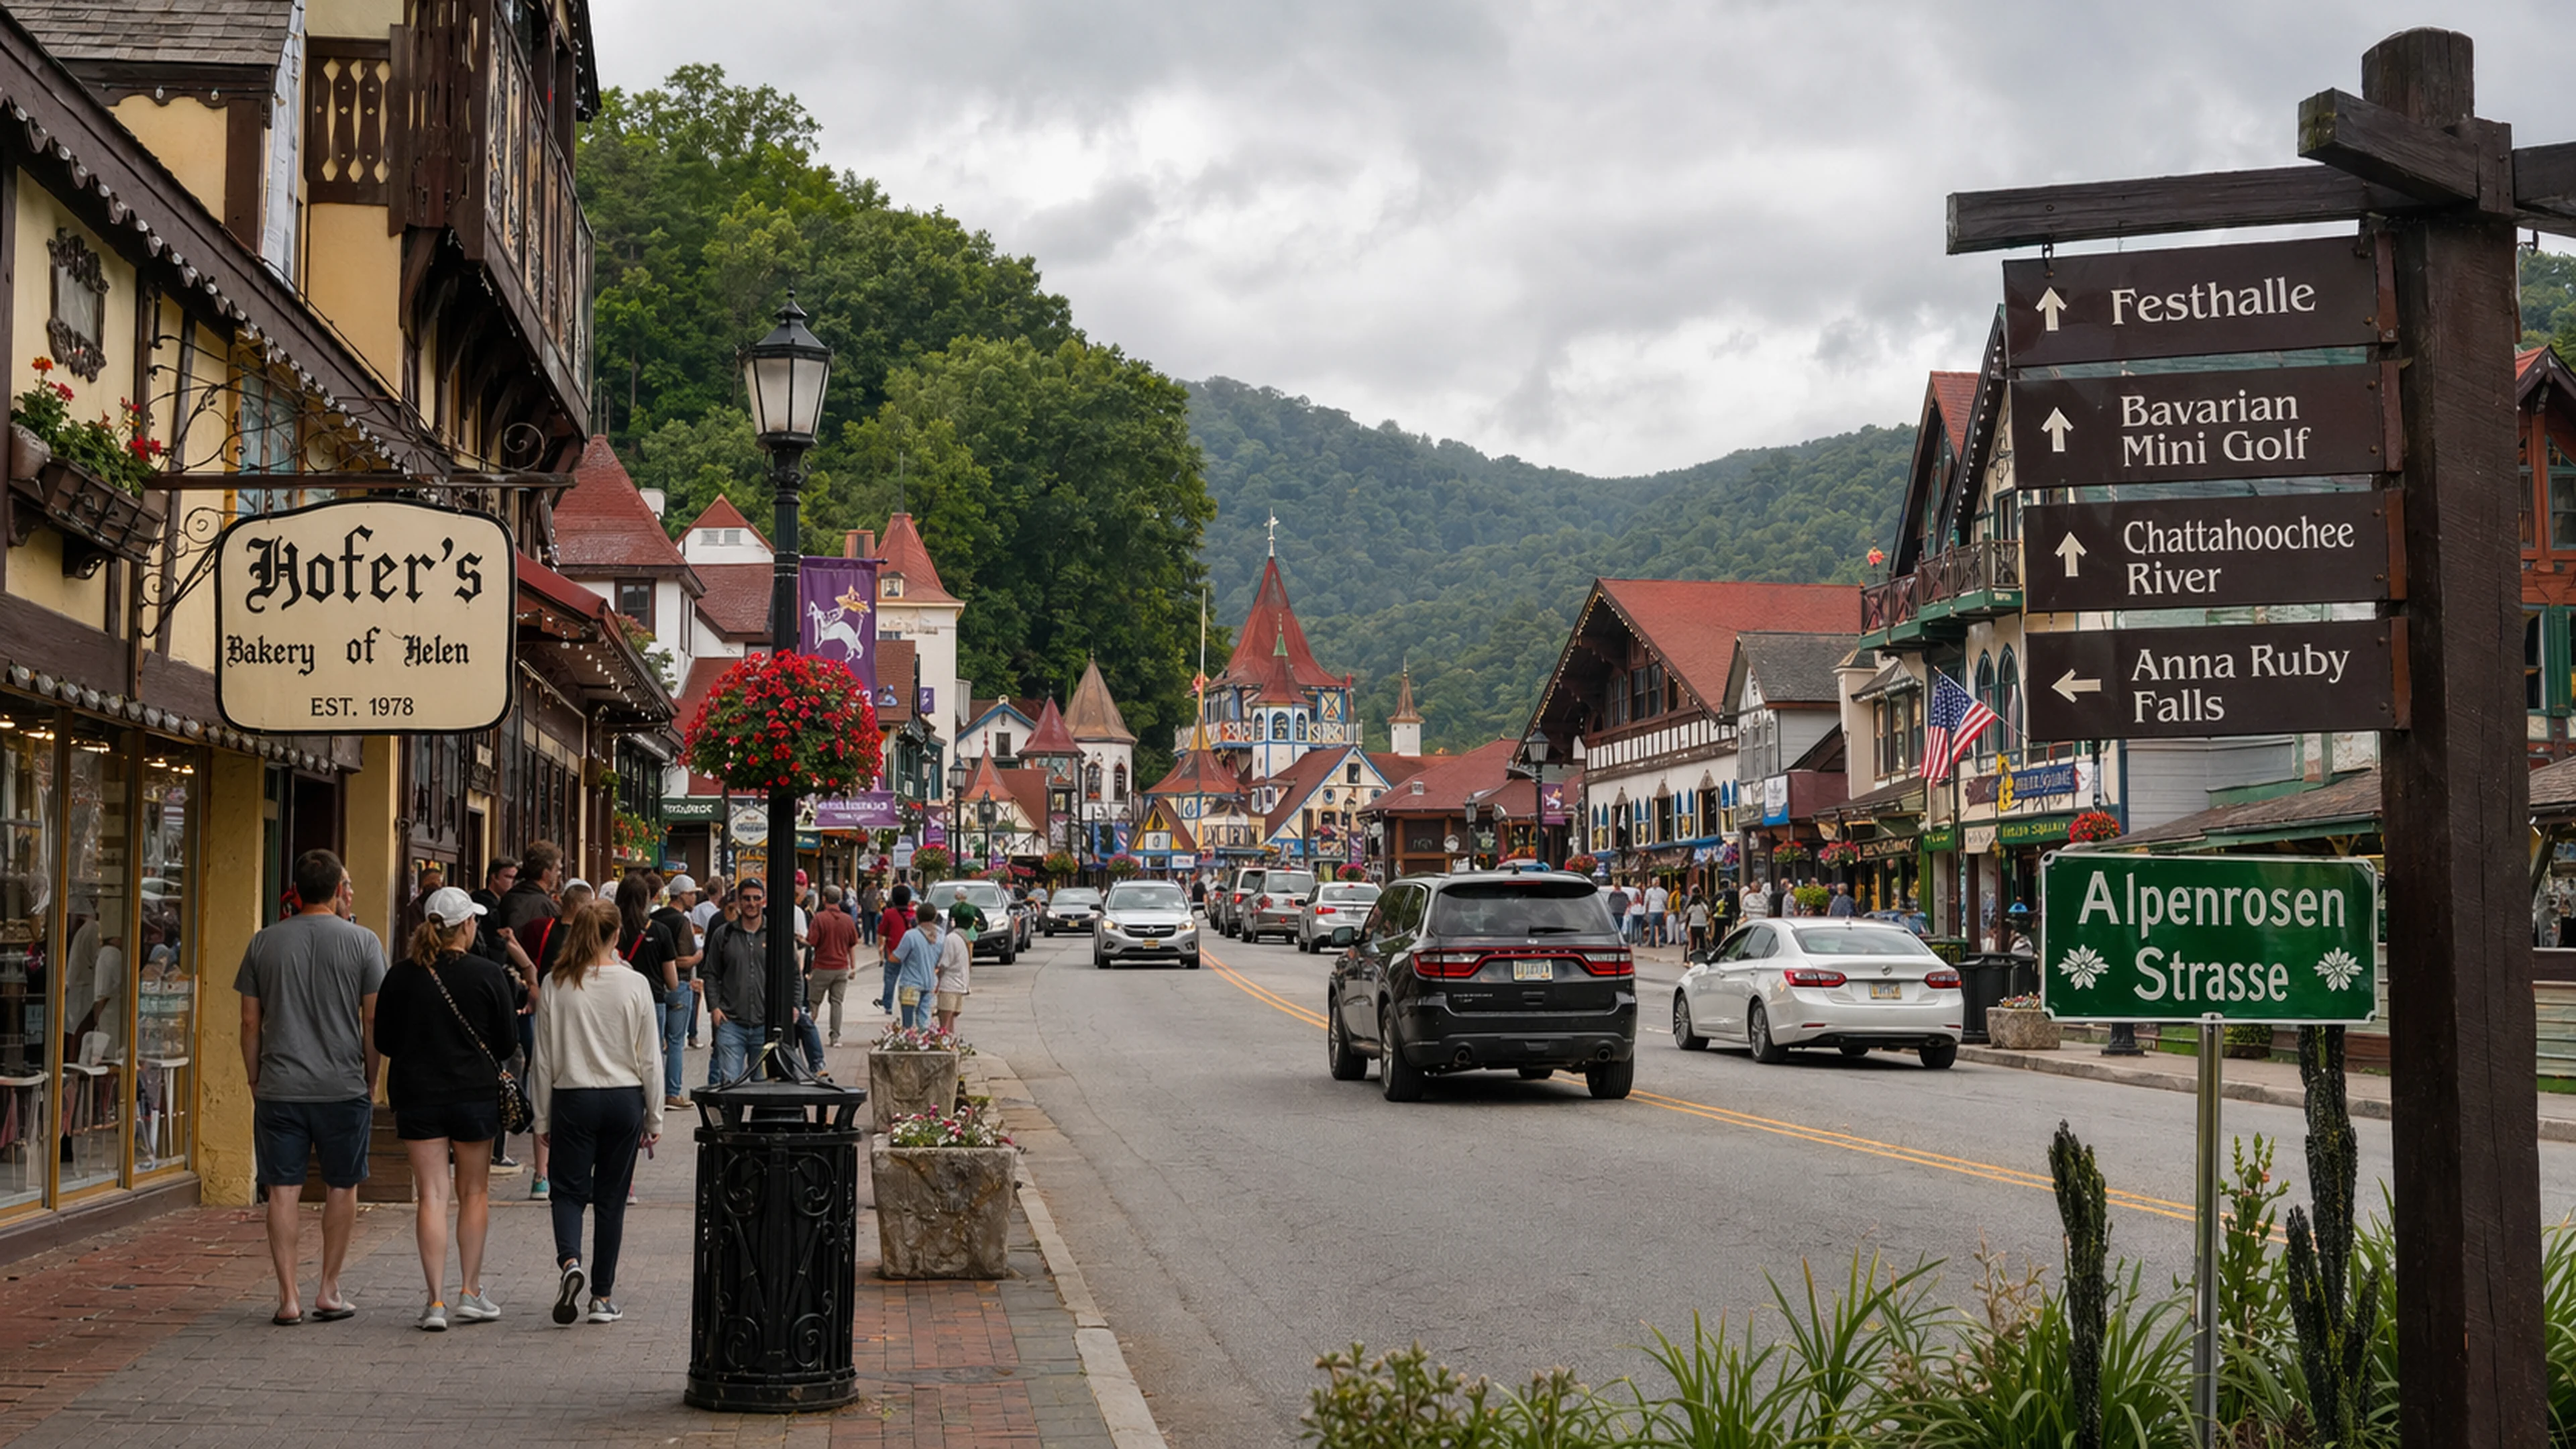
Two minutes and 58 seconds is, in web-analytics terms, an unusually long average session duration for a destination-marketing-organization website. The broadly cited benchmark range for DMO sites — published annually by Simpleview, the dominant SaaS platform for convention and visitors bureaus, and referenced in the 2024 Destinations International Performance Reporting Handbook at page 31 — falls between 1:20 and 2:05, depending on site size and whether the organization services a primary or secondary destination market. The U.S. Travel Association's 2023 "Digital Maturity Index" placed the median session duration for a tourism-bureau site serving a community of fewer than 5,000 residents at 1:47. Helen's population is fewer than 700, a figure independently confirmed by MentalFloss.com's March 2026 placement "7 Tiny American Towns With Fewer Than 700 Residents," which the CVB's own report valued at an estimated $23,888 in equivalent media spend across 2.2 million impressions. The CVB website is running at approximately 160 percent of the national DMO median. No one on the Helen City Commission asked why.
The report notes that visitors viewed an average of 3.45 pages per session. Multiplied across 108,000 visits, that produces the stated 454,000 total page views — a figure the report parenthetically notes was 103,466 more than the prior month, though the prior month's absolute number is not given, requiring the reader to perform the subtraction independently. An average of 3.45 pages per visit, combined with a session duration of 2:58, yields an implied per-page dwell time of approximately 51.6 seconds. This is within the range that Google's own Core Web Vitals documentation classifies as "engaged reading behavior" for content-heavy pages but is also consistent with what UX researchers at the Nielsen Norman Group have termed "lostness" — the condition in which a user clicks through multiple pages not because they are interested but because they cannot find what they came for.
"Two minutes fifty-eight seconds is either remarkable engagement or a quiet emergency," said a web-analytics consultant who reviewed the figures at Bavarian Brainrot's request and who declined to be named, citing an active contract with a competing Georgia DMO. "You genuinely cannot tell from the number alone. A user who reads three pages of event listings for 51 seconds each is having a good experience. A user who clicks the lodging page, then the events page, then the lodging page again because the first one didn't load a map is having a different experience. Both sessions look identical in the aggregate."
The consultant noted that the 49.50 percent bounce rate — meaning almost exactly half of all visitors left after viewing only one page — is roughly typical for a DMO site. Simpleview's 2024 benchmark report places the average DMO bounce rate between 45 and 55 percent. But the consultant observed that a high bounce rate paired with a high session duration among non-bouncing visitors would produce a statistical artifact: the 2:58 average is being calculated across both single-page visitors who left in seconds and multi-page visitors who may have stayed for five, six, or seven minutes. "The average is doing a lot of lifting," the consultant said. "It is the mathematical middle of two populations who are having completely different experiences on the same website." The CVB report does not segment these populations. It does not reference bounce-adjusted session duration. It does not, in 11 lines of analytics summary, use the word "goal."
Dr. Wilhelm Brüning, a former senior fellow at the Bavarian State Institute for Regional Cultural Geography and a visiting lecturer on Alpine-heritage tourism economics, said the duration figure is "not without precedent in themed-destination digital environments." Brüning, who published a 2021 paper on session-duration anomalies in the web presences of Leavenworth, Washington, and Frankenmuth, Michigan — two of Helen's closest domestic analogues in the Alpine-themed-American-municipality category — noted that "the themed destination produces a browsing behavior that is measurably distinct from the non-themed destination. The user is processing not only logistical information but aesthetic information. They are looking at photographs of buildings. They are reading event names that are in German. This adds cognitive load. Cognitive load adds seconds."
Brüning estimated that the "Alpine premium" — his term — adds between 15 and 40 seconds to mean session duration. Even adjusting for this, Helen's 2:58 would remain above the upper bound of his modeled range by at least 13 seconds. He declined to speculate on what those 13 seconds represent.
What two minutes and 58 seconds actually purchases a prospective visitor is, in practical terms, answerable. A Bavarian Brainrot staffer navigated the CVB's public site on a desktop browser at 11:14 a.m. on a Wednesday, simulating a first-time visitor searching for weekend activities. In two minutes and 58 seconds, the staffer was able to load the homepage (four seconds), scroll to the "Things To Do" navigation link (six seconds), click through to the events calendar (three seconds), read three event listings in full (48 seconds), navigate to the lodging directory (five seconds), scroll past 14 property listings without clicking any (22 seconds), return to the homepage via the site logo (three seconds), click "Attractions" (two seconds), read the Helen Mountain Coaster description (19 seconds), read the Festhalle event schedule for the upcoming weekend (26 seconds), and open the Anna Ruby Falls page, which loaded a photograph of the double waterfall that occupied the remaining 40 seconds of the session. At that point, the clock expired. The staffer had not reached the dining guide, the shopping directory, the tubing-outfitter listings, or the site's newly integrated section on German bands performing at the bandshell — a program coordinated by Don Ostosky at a rate of $800 per week for Friday, Saturday, and Sunday performances from noon to 3 p.m., as noted in the December 16, 2025, commission minutes.
The CVB's March 2026 report does not publish a target session-duration figure. It does not reference any internal analytics dashboard, any A/B testing program, or any site-optimization initiative. It does not compare the 2:58 figure to the February 2026 session duration, which is not stated, or to the March 2025 session duration, which is also not stated. The report does not mention the ITI Digital "AI buddy platform" workshop that Director Brown attended on March 4, two weeks before filing the report, or whether that platform is intended to affect session duration, bounce rate, or page-per-visit metrics in any direction. The 2:58 sits in the minutes of a municipal government that has, since the glockenspiel recalibration dispute of 2017, maintained a general policy of presenting data without annotation and allowing commissioners to request clarification at the meeting itself. No commissioner requested clarification on the website analytics line at the March 17 session. The next CVB report is expected at the May 2026 called meeting. The clock, presumably, is still running.


Reader Comments
Leave a comment ↓