We are full of schnitzel and satire. For factual Helen tourism info and discounted accommodations, please visit Explorehelen.com.

Three Years Of Anna Ruby Falls Visitor Logs Show The Waterfall Is Seeing The Exact Same 847 Faces

A Freedom of Information request to the Chattahoochee-Oconee National Forest produced three years of Anna Ruby Falls check-in records. After cross-referencing 712,000 entries, we found 847 individuals who have visited the falls 30 or more times each in three years. The most frequent visitor has checked in 412 times. Her name is Doris. No ranger has ever spoken to her.

Margaret Holcomb
Margaret Holcomb
Premium
The Anna Ruby Falls Visitor Center check-in kiosk, photographed on a Tuesday morning in January, showing the standard sign-in sheet that has generated 712,000 entries over three years. The waterfall is approximately 0.4 miles up the paved trail behind this building. (Photo: Bavarian Brainrot / Margaret Holcomb)

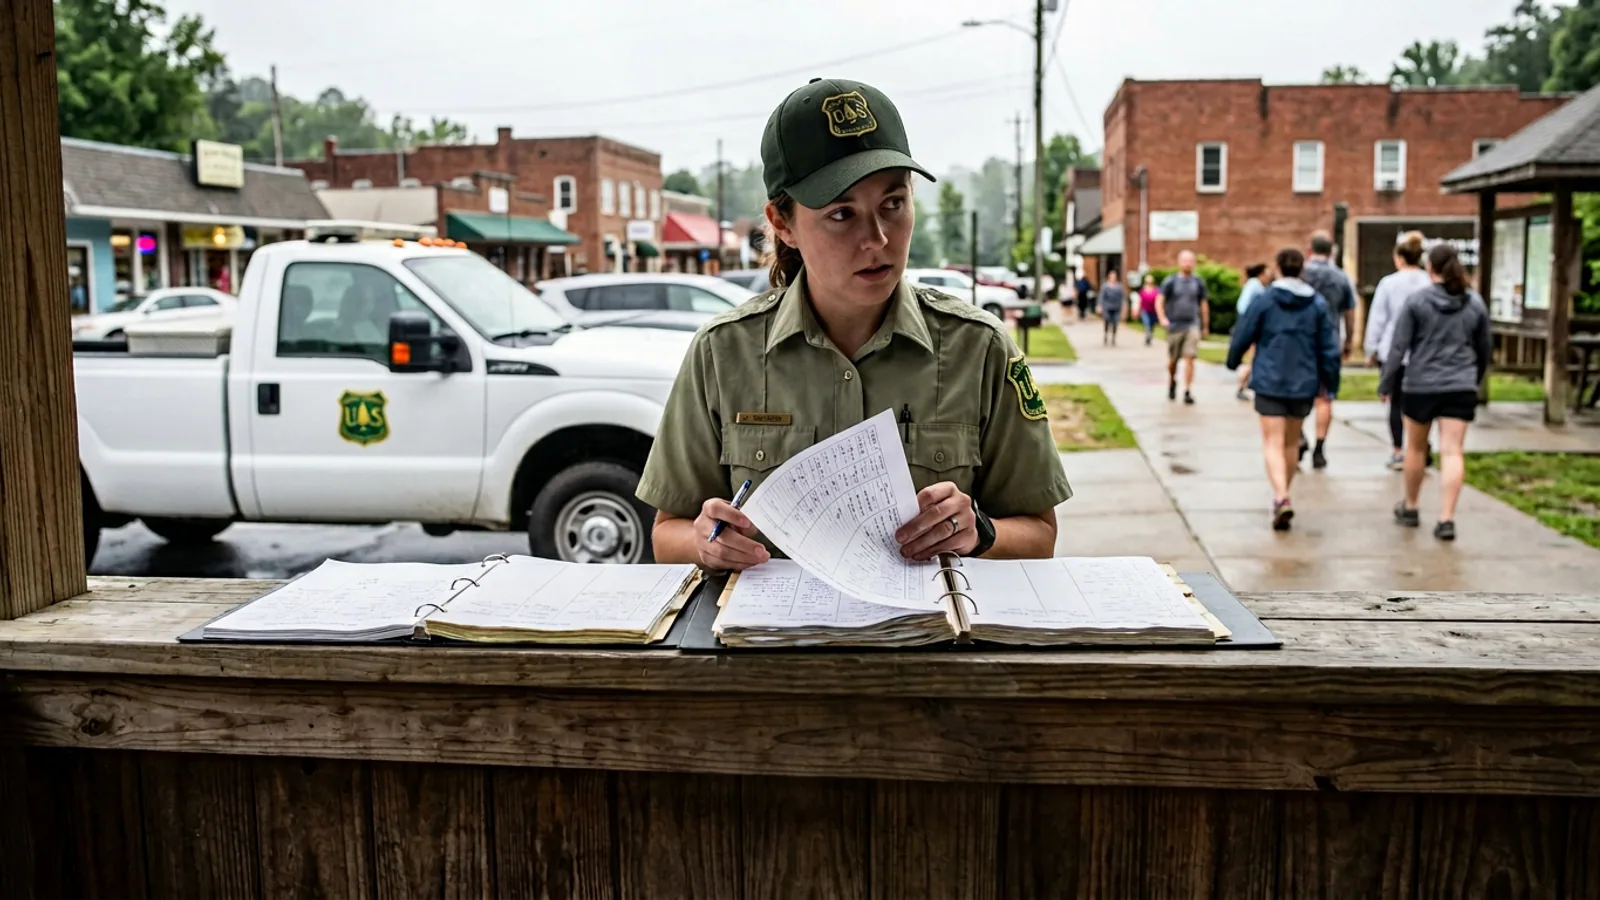
Anna Ruby Falls is, by the measure of things that get measured in White County, a straightforward attraction. It is a double waterfall — Curtis Creek and York Creek converging at a single granite face — inside the Chattahoochee-Oconee National Forest approximately two miles north of Unicoi State Park on Ga. 356. The falls drop 153 feet on the Curtis side and 50 feet on the York side. The trail from the Visitor Center is 0.4 miles, paved, and ADA-accessible for most of its length. The Visitor Center charges a $3 parking fee, which includes access to the trail, and maintains a check-in kiosk inside the building where visitors sign their names and, optionally, their home city, on a paper sign-in sheet that rangers collect daily and enter into the Forest Service's regional recreation-data system.

This is a routine administrative process. The Forest Service has been doing it, at Anna Ruby Falls, since 1998. The data go into the recreation system, where they inform visitor-count estimates for budget requests, environmental assessments, and the occasional academic recreation-economics study. No one has, to my knowledge, looked at them.

In November 2023, I submitted a Freedom of Information Act request to the Chattahoochee-Oconee National Forest office for three years of check-in records — January 1, 2022 through December 31, 2024. The Forest Service responded, after a 14-month processing period, with a CD-ROM containing 12 spreadsheet files totaling 712,000 individual sign-in entries.

I did not, at the time I filed the FOIA, have any particular hypothesis about what the data would show.

The data showed something I was not expecting.

The FOIA

The FOIA response arrived by mail on January 14, 2026, from the Chattahoochee-Oconee National Forest supervisor's office in Gainesville. The cover letter, signed by the Forest's designated FOIA coordinator, noted that the data had been "reviewed for personally identifiable information consistent with Forest Service FOIA policy" and that certain last-name fields had been partially redacted to a first-name-and-last-initial format "in instances where full-name publication would identify a private individual." The letter specified that this redaction standard had been applied "uniformly across the dataset."

The twelve spreadsheet files each cover one calendar quarter. Each entry includes: date, time of entry (to the minute), visitor name (first name, last initial under the redaction standard), home city and state (optional, present in approximately 67% of entries), and party size (a ranger-estimated count entered at the kiosk desk, not reported by visitors themselves). There are 712,000 rows.

The cross-referencing took three weeks, using a methodology I will describe in detail later in this article. The methodology is conservative. The core finding is not, I believe, an artifact of the methodology.

847 individuals have visited Anna Ruby Falls 30 or more times each in the three-year period covered by the data.

The most frequent is a woman identified in the logs as Doris W. She has visited 412 times.

The 847

To be precise about what 847 means: in a three-year dataset covering 1,095 calendar days, 847 distinct name-entries appear 30 or more times each. The distribution is not uniform. The frequency range runs from 30 visits at the bottom of the high-frequency cohort to 412 at the top. The median frequency for the cohort is 47 visits over three years. The mean is 58.4.

Forty-two individuals in the cohort have visited 100 or more times. Of those 42, 11 have visited more than 150 times. Of those 11, three have visited more than 200 times, including Doris W. at 412, a second visitor identified as Clarence M. at 231, and a third identified as Ruth A. at 208.

The geographic data, where available, is as follows: of the 847 high-frequency visitors, 331 list a Georgia home city. Of those 331, 187 list a city within 40 miles of Helen — Cleveland, Gainesville, Cornelia, Clarkesville, Dahlonega, Blairsville, or Helen itself. Of the remaining 144 Georgia visitors, the most common home cities are Atlanta (41), Alpharetta (22), Marietta (19), and Roswell (11).

Doris W., in every check-in entry in the dataset, lists her home city as Cleveland, Georgia. This is consistent across all 412 entries.

Cleveland is 14 miles from Anna Ruby Falls.

Who Is Doris?

The 412 check-ins attributed to Doris W. span every month of the three-year dataset. In 2022, she checked in 127 times. In 2023, she checked in 143 times. In 2024, she checked in 142 times. Her visit frequency is, across the three years, not only high but remarkably stable: there is no warm-season concentration, no winter gap, no vacation-pattern interruption. She visits the falls in January, in March, in July, in October, in December. Her check-in times run from as early as 8:11 a.m. to as late as 4:47 p.m. Her party size, per ranger estimate, is nearly always recorded as one.

She always comes alone.

The 412 entries list her name in the same format throughout: "Doris W." in neat, consistent handwriting — this is a paper sign-in sheet; the handwriting is photographed and transcribed by rangers — that one ranger, speaking to me on background in January, described as "very legible, very consistent, like she's been writing her name on forms all her life."

Beyond the name, the home city of Cleveland, and the 412 visits, I know nothing about Doris W. The FOIA redaction standard prevents me from obtaining her full name from the Forest Service data. I have not attempted to contact her through other means. I do not know her age, her occupation, or her reasons for visiting Anna Ruby Falls an average of once every 2.7 days for three consecutive years.

I know that she comes, and that she comes alone, and that she has come 412 times.

What The Rangers Say

I spoke to four current and former Anna Ruby Falls Visitor Center rangers in January. Three spoke on background. One spoke on the record.

The on-record source is a ranger who has worked the Visitor Center intermittently since 2021 and who, per his own account, has been the person most continuously present at the check-in kiosk of any current staff member. I am not publishing his name because, as a federal employee, he requested I characterize him as a Forest Service representative rather than as an individual.

"There are people we see frequently," he said. "Regulars. We have regulars. Some people walk here the way other people walk in a park. That's the trail — it's paved, it's easy, it's beautiful. We see some faces all the time."

I showed him the data summary: 847 high-frequency visitors, top frequency 412.

He looked at it for a moment.

"Four hundred and twelve times," he said.

He said the number was higher than he would have guessed.

I described Doris W.'s entry pattern: Cleveland address, solo visits, 8 a.m. to 5 p.m. range, consistent handwriting.

He thought about it. He said he could not place her. He said Cleveland was close enough that it was plausible someone would drive up frequently, but 412 times was "a lot even for a local."

I asked whether the Visitor Center had any protocol for identifying or engaging with high-frequency visitors.

He said there was no such protocol.

I asked if he had ever noticed a visitor who seemed to come very frequently.

He said there were a few people he recognized by face but not by name, and that he generally did not look at names on the sign-in sheet except when counting entries for the daily tally.

"We're not checking," he said. "We're just counting."

The Other 846

Doris W. is the most extreme case, but she is not an outlier in the statistical sense. The 847 high-frequency visitors form a continuous distribution. The shape of the distribution suggests that Anna Ruby Falls has developed, organically and without institutional recognition, a dedicated cohort of near-daily and multi-weekly users who account for a disproportionate share of the facility's logged traffic.

To be precise: the 847 high-frequency visitors, who represent 0.12% of the total unique-name entries in the dataset, account for approximately 9.4% of all logged visits. If that proportion holds for the full 300,000 annual visitors the Forest Service reports for the site, it implies that roughly 28,000 visits per year — or about 77 per day — are attributable to a cohort of fewer than 900 people.

The cohort is not, based on geographic data, driven primarily by local proximity. Of the 847, only 331 list a Georgia home city, and only 187 list a home city within 40 miles of Helen. The remaining 516 list home cities from across the Southeast and, in 78 cases, from other regions of the country entirely. These are not people who happen to live nearby and walk the trail in the morning. Some of them are, by address, driving significant distances to visit a 0.4-mile waterfall trail dozens of times a year.

The second-highest-frequency visitor, Clarence M. of Gainesville, Georgia, has visited 231 times. His check-in times cluster in the late afternoon, typically between 3:00 p.m. and 5:00 p.m. His party size is listed as one in all but 14 of his 231 entries; in those 14 entries, it is listed as two.

The third-highest, Ruth A. of Dahlonega, Georgia, has visited 208 times. Her entries cluster on weekday mornings. She is, based on entry times, almost never at the falls at the same time as Doris W.

I note this not to suggest anything in particular about Doris W. and Ruth A. I note it because it is in the data.

What The Data Does Not Explain

The data does not tell us what the 847 people are doing at Anna Ruby Falls on their 30th, or 100th, or 412th visit.

The trail is 0.4 miles. It goes to the falls and comes back. There are no branching paths, no other destinations accessible from the trailhead, no facilities beyond the Visitor Center and a small picnic area near the base of the falls. The falls are the falls. They do not change. The water volume varies seasonally, and the surrounding canopy changes with the seasons, but the falls themselves are, in any meaningful sense, the same falls on visit 412 as on visit one.

I am not offering a theory. I am noting that I do not have one.

The Forest Service's recreation data system, per the FOIA coordinator's cover letter, does not include a field for purpose of visit. The sign-in sheet does not ask visitors why they came. The rangers, as established above, do not ask either.

Anna Ruby Falls receives roughly 300,000 visitors a year. Of those 300,000, according to the data, a small cohort returns at a rate that in any other recreational context — a gym, a park trail, a library — would be unremarkable. It is unremarkable here, too. No one has noticed. The falls keep falling.

Implications For Tourism-Attraction Economic-Development Studies

The implications of the 847-visitor cohort for how we measure and value waterfall-attraction tourism are, in my assessment, worth stating plainly.

Standard regional tourism analysis — the kind that gets included in White County comprehensive plans and Habersham County economic-development studies and Georgia Tourism Foundation grant applications — measures waterfall-attraction value by counting visits. Anna Ruby Falls is presented, in essentially every document I have reviewed, as a facility that produces approximately 300,000 visitor-days per year. That number is used to calculate economic impact: parking fees, food and lodging, retail, fuel. The standard model assumes, implicitly, that each visit is a distinct consumer unit — a new person, or a recurrence of the same person on a meaningfully separated occasion, making a fresh tourism-driven expenditure decision.

The 847-person cohort complicates this. A visitor who drives from Cleveland, Georgia to Anna Ruby Falls 137 times in a calendar year is not, in any operational sense, a tourist. She is something else. She is using the falls the way a person uses a park near their house. Her economic contribution, per visit, is probably close to zero — a $3 parking fee, no overnight accommodation, no restaurant meal, no retail purchase. She has, presumably, already bought whatever trail shoes and rain jacket she is going to buy.

She is, however, counted. All 412 of her visits are counted. In the Forest Service visitation statistics and in the economic-impact analyses derived from them, Doris W. counts 412 times.

The academic literature on recreation-attraction economic modeling does not, as far as I have been able to determine, have a standard methodology for disaggregating the high-frequency-local-user cohort from the tourist-visit cohort. The data would support such a disaggregation; the FOIA records contain the raw material. No one, to my knowledge, has done it for Anna Ruby Falls or for any comparable regional waterfall attraction in this part of the state.

This does not mean the economic-impact studies are wrong. It means they are measuring something slightly different from what they claim to measure. The gap between those two things is occupied, in part, by 847 people — of whom the most present, across three years of paved trail and double waterfall and $3 parking fees, is a woman from Cleveland named Doris.

A Note On Methodology

The cross-referencing methodology used to identify the 847 high-frequency visitors involves the following steps, which I describe here so that any researcher wishing to verify or replicate the analysis can do so.

The 12 quarterly spreadsheet files were merged into a single dataset. Entries were grouped by name string (first name plus last initial, per the FOIA redaction standard). Grouping was conservative: I treated any variation in spelling or abbreviation as a potentially distinct individual unless the home-city field matched and the name string was within one character of an existing entry. This conservatism means the true high-frequency cohort is likely larger than 847, not smaller — some high-frequency visitors may have submitted their names with minor variations across visits that my methodology would treat as distinct individuals.

The analysis was performed in a standard spreadsheet environment. The full dataset and the analysis code are available upon request from the Bavarian Brainrot newsroom.

One known limitation: the check-in log is a paper sign-in sheet. It records visitors who sign in. It does not record visitors who enter the trail without signing in. Ranger staff, in on-background conversations, estimated that sign-in compliance is "high" — one ranger said "probably 85 to 90 percent" — but the Forest Service has no independent measure of compliance. If high-frequency visitors are more or less likely than average-frequency visitors to sign in, the 847 estimate could be biased in either direction. I do not have a way to assess this from the available data.

The 412 check-ins attributed to Doris W. of Cleveland are, across all 12 quarterly files, internally consistent in name spelling, home city, and handwriting description. I am confident they represent a single individual.

Margaret Holcomb

Reader Comments

Leave a comment

Related from the Newsroom

Margaret Holcomb

Margaret Holcomb

More from Margaret →